
Age structure, sex ratio and Rural-Urban composition of India
Rural-Urban Composition:
For the first time since Independence, the absolute increase in population is more in urban areas that in rural areas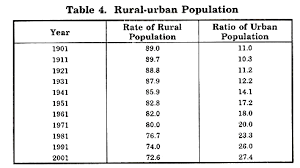
Rural Population in India: 68.84%
Urban Population in India:31.16%
Level of urbanization increased from 27.81% in 2001 Census to 31.16% in 2011 Census
The proportion of rural population declined from 72.19% to 68.84%
| INDIA/STATE/UT | TOTAL POPULATION | RURAL POPULATION | URBAN POPULATION | RURAL POP PERCENTAGE | URBAN POP PERCANTAGE |
| A & N ISLANDS | 3,79,944 | 2,44,411 | 1,35,533 | 64.33 | 35.67 |
| ANDHRA PRADESH | 8,46,65,533 | 5,63,11,788 | 2,83,53,745 | 66.51 | 33.49 |
| ARUNACHAL PRADESH | 13,82,611 | 10,69,165 | 3,13,446 | 77.33 | 22.67 |
| ASSAM | 3,11,69,272 | 2,67,80,516 | 43,88,756 | 85.92 | 14.08 |
| BIHAR | 10,38,04,637 | 9,20,75,028 | 1,17,29,609 | 88.7 | 11.3 |
| CHANDIGARH | 10,54,686 | 29,004 | 10,25,682 | 2.75 | 97.25 |
| CHHATTISGARH | 2,55,40,196 | 1,96,03,658 | 59,36,538 | 76.76 | 23.24 |
| DADRA & NAGAR HAVELI # | 3,42,853 | 1,83,024 | 1,59,829 | 53.38 | 46.62 |
| DAMAN & DIU | 2,42,911 | 60,331 | 1,82,580 | 24.84 | 75.16 |
| GOA | 14,57,723 | 5,51,414 | 9,06,309 | 37.83 | 62.17 |
| GUJARAT | 6,03,83,628 | 3,46,70,817 | 2,57,12,811 | 57.42 | 42.58 |
| HARYANA | 2,53,53,081 | 1,65,31,493 | 88,21,588 | 65.21 | 34.79 |
| HIMACHAL PRADESH | 68,56,509 | 61,67,805 | 6,88,704 | 89.96 | 10.04 |
| INDIA | 1,21,01,93,422 | 83,30,87,662 | 37,71,05,760 | 68.84 | 31.16 |
| JAMMU & KASHMIR | 1,25,48,926 | 91,34,820 | 34,14,106 | 72.79 | 27.21 |
| JHARKHAND | 3,29,66,238 | 2,50,36,946 | 79,29,292 | 75.95 | 24.05 |
| KARNATAKA | 6,11,30,704 | 3,75,52,529 | 2,35,78,175 | 61.43 | 38.57 |
| KERALA | 3,33,87,677 | 1,74,55,506 | 1,59,32,171 | 52.28 | 47.72 |
| LAKSHADWEEP | 64,429 | 14,121 | 50,308 | 21.92 | 78.08 |
| MADHYA PRADESH | 7,25,97,565 | 5,25,37,899 | 2,00,59,666 | 72.37 | 27.63 |
| MAHARASHTRA | 11,23,72,972 | 6,15,45,441 | 5,08,27,531 | 54.77 | 45.23 |
| MANIPUR | 27,21,756 | 18,99,624 | 8,22,132 | 69.79 | 30.21 |
| MEGHALAYA | 29,64,007 | 23,68,971 | 5,95,036 | 79.92 | 20.08 |
| MIZORAM | 10,91,014 | 5,29,037 | 5,61,977 | 48.49 | 51.51 |
| NAGALAND | 19,80,602 | 14,06,861 | 5,73,741 | 71.03 | 28.97 |
| NCT OF DELHI | 1,67,53,235 | 4,19,319 | 1,63,33,916 | 2.5 | 97.5 |
| ORISSA | 4,19,47,358 | 3,49,51,234 | 69,96,124 | 83.32 | 16.68 |
| PUDUCHERRY | 12,44,464 | 3,94,341 | 8,50,123 | 31.69 | 68.31 |
| PUNJAB | 2,77,04,236 | 1,73,16,800 | 1,03,87,436 | 62.51 | 37.49 |
| RAJASTHAN | 6,86,21,012 | 5,15,40,236 | 1,70,80,776 | 75.11 | 24.89 |
| SIKKIM | 6,07,688 | 4,55,962 | 1,51,726 | 75.03 | 24.97 |
| TAMIL NADU | 7,21,38,958 | 3,71,89,229 | 3,49,49,729 | 51.55 | 48.45 |
| TRIPURA | 36,71,032 | 27,10,051 | 9,60,981 | 73.82 | 26.18 |
| UTTAR PRADESH | 19,95,81,477 | 15,51,11,022 | 4,44,70,455 | 77.72 | 22.28 |
| UTTARAKHAND | 1,01,16,752 | 70,25,583 | 30,91,169 | 69.45 | 30.55 |
| WEST BENGAL | 9,13,47,736 | 6,22,13,676 | 2,91,34,060 | 68.11 | 31.89 |
Age Structure:
Age- sex structure is one of the most important characteristics of population composition. Almost all population characteristics vary significantly with age.
Information is included by sex and age group (0-14 years,  15-64 years, 65 years and over). The age structure of a population affects a nation’s key socioeconomic issues. Countries with young populations (high percentage under age 15) need to invest more in schools, while countries with older populations (high percentage ages 65 and over) need to invest more in the health sector. The age structure can also be used to help predict potential political issues. For example, the rapid growth of a young adult population unable to find employment can lead to unrest.
Below is the age structure of India:
0-14 years: 27.71% (male 186,420,229/female 164,611,755)
15-24 years: 17.99% (male 121,009,850/female 106,916,692)
25-54 years: 40.91% (male 267,203,029/female 251,070,105)
55-64 years: 7.3% (male 46,398,574/female 46,105,489)
65 years and over: 6.09% (male 36,549,003/female 40,598,872) (2016 est.)
Sex Ratio:
Sex ratio is used to describe the number of females per 1000 of males. Sex ratio is a valuable source for finding the population of women in India and what is the ratio of women to that of men in India.
In the Population Census of 2011 it was revealed that the population ratio in India 2011 is 940 females per 1000 of males. The Sex Ratio 2011 shows an upward trend from the census 2001 data. Census 2001 revealed that there were 933 females to that of 1000 males.
While Kerala with sex ratio of 1084 top the list, Daman and Diu with sex ratio of 618 is at the bottom of the list.
Below is the list of states according to the sex ration. In the list we can see the states with good sex ratio.
| 2011 Census | 2001 Census | ||||
| # | State | Sex Ratio | Child Sexratio | Sex Ratio | Child Sexratio |
| – | India | 943 | 919 | 933 | 927 |
| 1 | Kerala | 1084 | 964 | 1058 | 960 |
| 2 | Puducherry | 1037 | 967 | 1001 | 967 |
| 3 | Tamil Nadu | 996 | 943 | 987 | 942 |
| 4 | Andhra Pradesh | 993 | 939 | 978 | 961 |
| 5 | Chhattisgarh | 991 | 969 | 989 | 975 |
| 6 | Meghalaya | 989 | 970 | 972 | 973 |
| 7 | Manipur | 985 | 930 | 974 | 957 |
| 8 | Orissa | 979 | 941 | 972 | 953 |
| 9 | Mizoram | 976 | 970 | 935 | 964 |
| 10 | Goa | 973 | 942 | 961 | 938 |
| 11 | Karnataka | 973 | 948 | 965 | 946 |
| 12 | Himachal Pradesh | 972 | 909 | 968 | 896 |
| 13 | Uttarakhand | 963 | 890 | 962 | 908 |
| 14 | Tripura | 960 | 957 | 948 | 966 |
| 15 | Assam | 958 | 962 | 935 | 965 |
| 16 | West Bengal | 950 | 956 | 934 | 960 |
| 17 | Jharkhand | 948 | 948 | 941 | 965 |
| 18 | Lakshadweep | 946 | 911 | 948 | 959 |
| 19 | Arunachal Pradesh | 938 | 972 | 893 | 964 |
| 20 | Nagaland | 931 | 943 | 900 | 964 |
| 21 | Madhya Pradesh | 931 | 918 | 919 | 932 |
| 22 | Maharashtra | 929 | 894 | 922 | 913 |
| 23 | Rajasthan | 928 | 888 | 921 | 909 |
| 24 | Gujarat | 919 | 890 | 920 | 883 |
| 25 | Bihar | 918 | 935 | 919 | 942 |
| 26 | Uttar Pradesh | 912 | 902 | 898 | 916 |
| 27 | Punjab | 895 | 846 | 876 | 798 |
| 28 | Sikkim | 890 | 957 | 875 | 963 |
| 29 | Jammu and Kashmir | 889 | 862 | 892 | 941 |
| 30 | Haryana | 879 | 834 | 861 | 819 |
| 31 | Andaman and Nicobar Islands | 876 | 968 | 846 | 957 |
| 32 | Delhi | 868 | 871 | 821 | 868 |
| 33 | Chandigarh | 818 | 880 | 777 | 845 |
| 34 | Dadra and Nagar Haveli | 774 | 926 | 812 | 979 |
| 35 | Daman and Diu | 618 | 904 | 710 | 926 |
BPCS Notes brings Prelims and Mains programs for BPCS Prelims and BPCS Mains Exam preparation. Various Programs initiated by BPCS Notes are as follows:-
- BPCS 2020 Mains (65th Mains) Tests and Notes Program
- BPCS Prelims Exam 2020 (66th Prelims)- Test Series and Notes Program
- BPCS Prelims and Mains 2020 Tests Series and Notes Program
- BPCS Detailed Complete Prelims Notes